By Victor Rao MBBS, DMRD, RDMS
Introduction
Fatty liver is characterized by the abnormal excessive accumulation of fat within the hepatocytes and Kupffer cells. Kupffer cell fat accumulation can lead to non-alcoholic steatohepatitis (NASH). Metabolic or non-alcoholic fatty liver disease (NAFLD), the most common form of fatty liver, is defined as hepatic fat infiltration in the absence of significant alcohol intake or other causes of liver disease.
The prevalence of NAFLD can reach up to 30% in certain populations. Fatty liver disease, especially NAFLD, is a growing serious health concern globally. NAFLD is present when more than 5% of hepatocytes are steatotic in patients who do not consume excessive alcohol (less than 20 grams/day for women and less than 30 grams per day for men) and the condition could range from simple steatosis to steatohepatitis through to advanced fibrosis and cirrhosis of the liver.
Luckily, up to 90% of patients with this condition may have simple steatosis with no increase in mortality. 10-30% of patients have the progressive form of NAFLD, non-alcoholic steatohepatitis (NASH), which is associated with inflammation and hepatocellular injury and may lead to cirrhosis in some cases. Patients with non-alcoholic steatohepatitis (NASH) are at high risk to develop hepatocellular carcinoma.
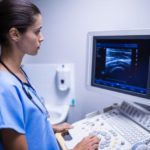
Ultrasound is the most widely used imaging modality for diagnosing and monitoring this condition. Point-of-care ultrasound (POCUS) provides advantages such as easy accessibility at the point of care, low cost and no exposure to ionizing radiation.
In this article we will learn about the use of POCUS to recognize the characteristic patterns of the disease and learn to confidently diagnose fatty liver and grade it, and understand the limitations of ultrasound, and briefly mention emerging quantitative methods. CT and MRI can be used to detect steatosis but are not routinely indicated for this condition. MRI and proton magnetic resonance spectroscopy are the most accurate non-invasive modalities to measure degree of steatosis.
B-mode Ultrasound
B-mode ultrasound evaluates liver echogenicity compared to the kidney and spleen. Increased liver echogenicity suggests fatty liver. It is important to note that ultrasound is effective in diagnosing steatosis when more than 33% of the hepatocytes are steatotic but is not reliable when less than 33% are steatotic. Ultrasound has a sensitivity and specificity of 60-94% and 84-95% respectively.
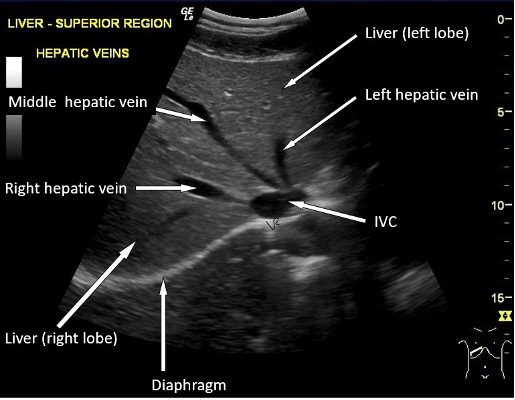
Figure 1. Normal liver parenchyma. The hepatic veins and diaphragm are clearly seen.
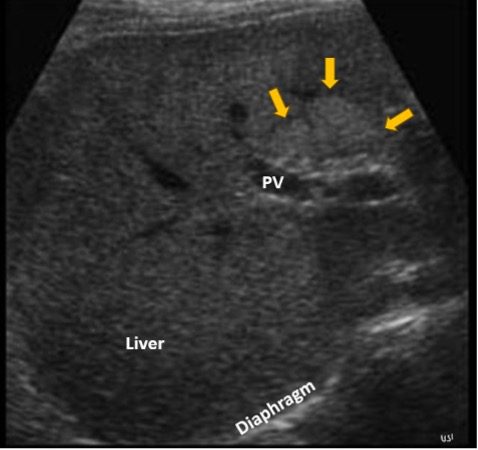
Figure 2. Focal fatty liver/steatosis seen anterior to the portal vein (PV). If you observe, in comparison to the image in Figure 1, the walls of the vessels are not seen well. This is consistent with Grade 2 fatty liver disease. Image courtesy of www.ultrasoundcases.info.
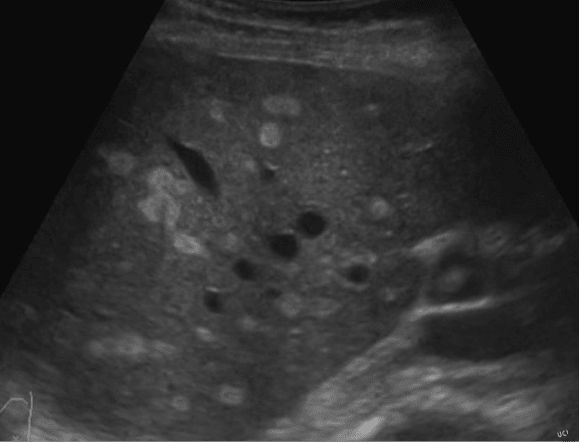
Figure 3. Focal fatty liver with multiple hyperechoic lesions which could be mistaken for liver metastases or even hemangiomas. Image courtesy of www.ultrasoundcases.info.
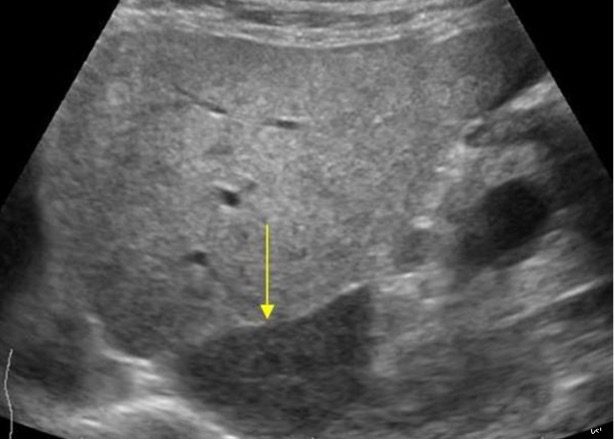
Figure 4. Fatty liver with non-fatty liver changes (focal sparing – yellow arrow) of the caudate lobe of the liver. Image courtesy of www.ultrasoundcases.info.
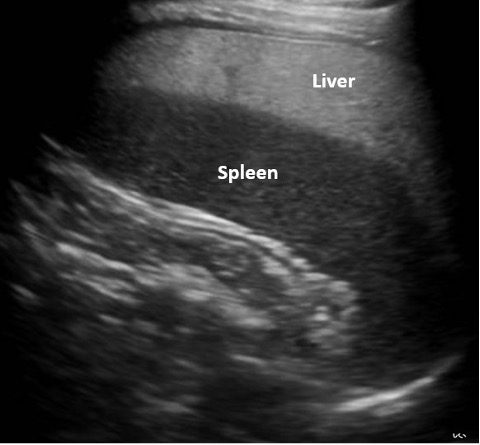
Figure 5. Observe the enlarged hyperechoic fatty liver anterior to the normal hypoechoic spleen seen posteriorly. Normally, we do not see the left lobe of the liver anterior to the spleen. In this example, the liver was enlarged and thus seen extending anterior to the spleen. Image courtesy of www.ultrasoundcases.info.
Grading Fatty Liver
Fatty liver can be graded by B-mode ultrasound imaging based on the echogenicity of the liver parenchyma and the degree of obscuration of the vascular structures within the liver parenchyma.
| Grade | Ultrasound Findings |
| Grade 1 (mild) | Slight increase in liver echogenicity, normal visualization of diaphragm and portal vein and branches. |
| Grade 2 (moderate) | Moderately increased echogenicity of the liver, slightly impaired visualization of the diaphragm and portal vein and branches walls. |
| Grade 3 (severe) | Marked increase in echogenicity of the liver, poor or no visualization of the diaphragm, portal veins and branches |
Table 1. Grading system for NAFLD with corresponding B-mode ultrasound findings.
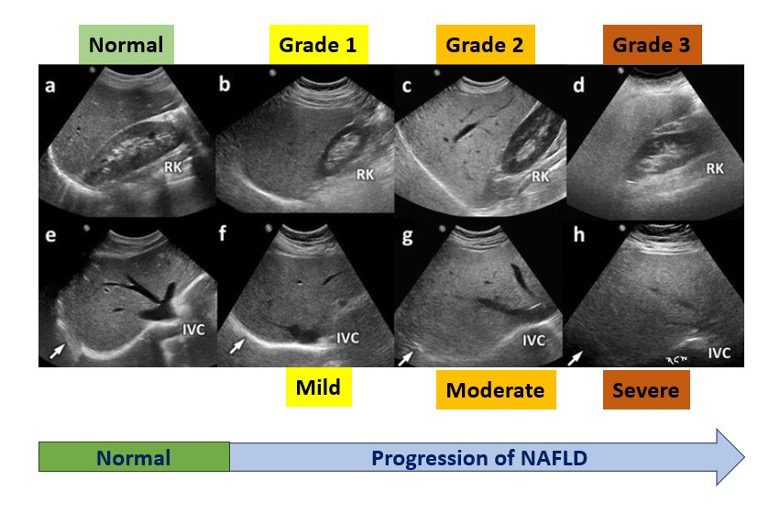
Figure 6. Progression of nonalcoholic fatty liver disease with ultrasound changes. Images (a-d) are the longitudinal images of the right lobe of the liver with a view of the right kidney for comparison of echotexture. Images (e-h) are the transverse view images of the corresponding patient above. Observe that as NAFLD progresses the liver parenchyma becomes progressively more hyperechoic, and the visualization of the diaphragm and portal vein branches and hepatic veins become increasingly impaired. Image courtesy of www.researchgate.net. Image labeled and modified from original image. See Table 1 for details on grading. Note that the normal liver and renal parenchyma echogenicity is almost similar in image (a) as compared to image (c). If you ever see such a stark contrast, fatty liver should be on your list of diagnosis.
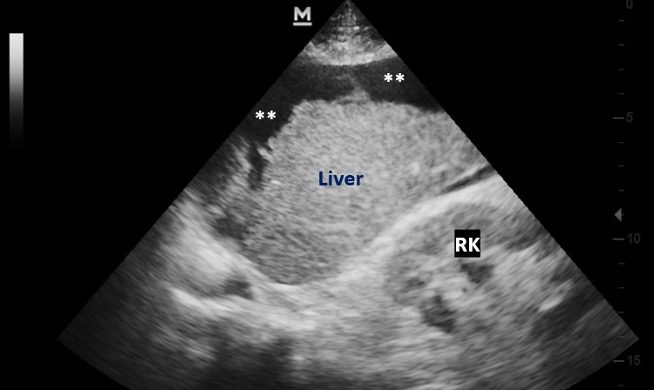
Figure 7. Advanced stage – liver is hyperechoic and shrunken with a nodular surface consistent with cirrhosis. Anechoic free fluid ** (ascites) is seen around the liver.
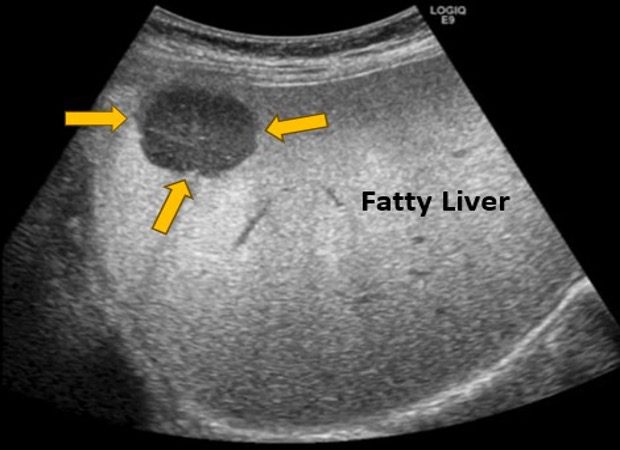
Figure 8. Moderate fatty liver with a well-defined hypoechoic slightly irregular mass (hepatocellular carcinoma). Image courtesy of Springer.com.
Limitations
Ultrasound may not be effective in diagnosis of fatty liver if less than 33% of hepatocytes are steatotic. The diagnosis could be operator dependent as the operator may not have the required amount of experience diagnosing this condition. Obesity, high BMI or overlying bowel gas may result in suboptimal imaging of the liver. Be aware of other pathologies that may be encountered in the liver.
Ultrasound is a major non-invasive modality for early assessment of NAFLD and hepatocellular carcinoma (HCC). You may complement a mass finding with color Doppler and contrast-enhanced ultrasound to improve diagnostic capability of smaller or isoechoic HCC lesions. Fusion ultrasound system is a new technology that may further improve detection of small HCC lesions.
Gold Standard Test
Liver biopsy is considered the gold standard for definitive grading of the condition and assessing the degree of fibrosis and inflammation in the liver tissue in patients with NAFLD. Histopathology is also the standard for confirmation of HCC. Be aware that liver biopsy may have an associated risk of bleeding and may not always be possible in patients with advanced liver disease with other comorbidities.
Emerging Technologies
Deep Learning (DL)
AI models using multi-view ultrasound images can classify fatty liver and estimate fat fraction, potentially improving diagnostic consistency and reducing operator dependence.
Quantitative US Parameters
Attenuation coefficient, backscatter coefficient, and sound speed estimation are under development for more objective and reproducible fat quantification.
Final Thoughts
B-mode ultrasound is a great imaging tool, and every clinician should be able to diagnose moderate to severe forms of fatty liver and cirrhosis. Biopsy is the gold standard test but is invasive and is not needed for all patients. Surprisingly, even a more than 1.85% increase of liver weight due to fat accumulation is associated with insulin resistance and increased cardiometabolic risk even in lean individuals. So, POCUS can help to diagnose the condition early and helps educate patients on potentials risks so they can take steps to mitigate and avoid serious health consequences several years down the road.
One patient who had cirrhosis and ascites told me that she would have preferred it if her physician had educated her and diagnosed fatty liver during the early stage of the disease process when she would have agreed to make major changes to lifestyle and diet to avoid a bad outcome. Even though ultrasound is not the gold standard, it is a practical tool to be used by POCUS users around the world to diagnose fatty liver and help educate and motivate their patient population to adopt healthy diet and lifestyle habits.
The goal of this blog article is to bring awareness to clinicians around the world so they can use ultrasound confidently to diagnose fatty liver and other related conditions. Clinicians can even share images with their patients, so the patients have a deeper understanding of their clinical condition.
References
- https://journals.lww.com/hep/fulltext/2011/09020/diagnostic_accuracy_and_reliability_of.36.aspx
- https://journals.lww.com/jmut/fulltext/2024/32020/update_on_imaging_based_noninvasive_methods_for.4.aspx
- https://pmc.ncbi.nlm.nih.gov/articles/PMC3872717/
- https://fg.bmj.com/content/5/3/211
- https://pmc.ncbi.nlm.nih.gov/articles/PMC6824276/
- https://publishing.escholarship.umassmed.edu/jgr/article/id/660/